
As a Generative AI Project Manager, you are the crucial link between a powerful, emerging technology and tangible business value. A fundamental part of this role is mastering the project’s finances. Unlike traditional software development, Generative AI initiatives have a unique and often substantial cost profile driven by data, intensive computation (GPUs), and specialized talent.
A detailed financial model is not just a formality; it is your most critical strategic tool. It empowers you to:
- Secure Executive Buy-In: Justify the investment to leadership with a clear, data-backed projection of costs, benefits, and potential ROI.
- Manage Financial Risk: Proactively identify, quantify, and budget for the high costs associated with model training and inference.
- Establish Guardrails: Create a budget that informs and guides the team’s technical and strategic decisions.
- Track Performance: Continuously measure actual spend against your forecast to keep the project on track and demonstrate accountability.
This guide provides a step-by-step approach to building a granular financial model, breaking down every potential cost and benefit to ensure your project is set up for success.
Section 1: The Anatomy of a Gen AI Financial Model
A robust model clearly separates one-time development costs from ongoing operational costs. This distinction is vital for understanding the initial investment required versus the long-term cost of ownership (TCO) for the solution.
Part A: Development & Setup Costs (CAPEX-like)
These are the upfront, one-time costs required to build, train, and prepare your model for its initial deployment.
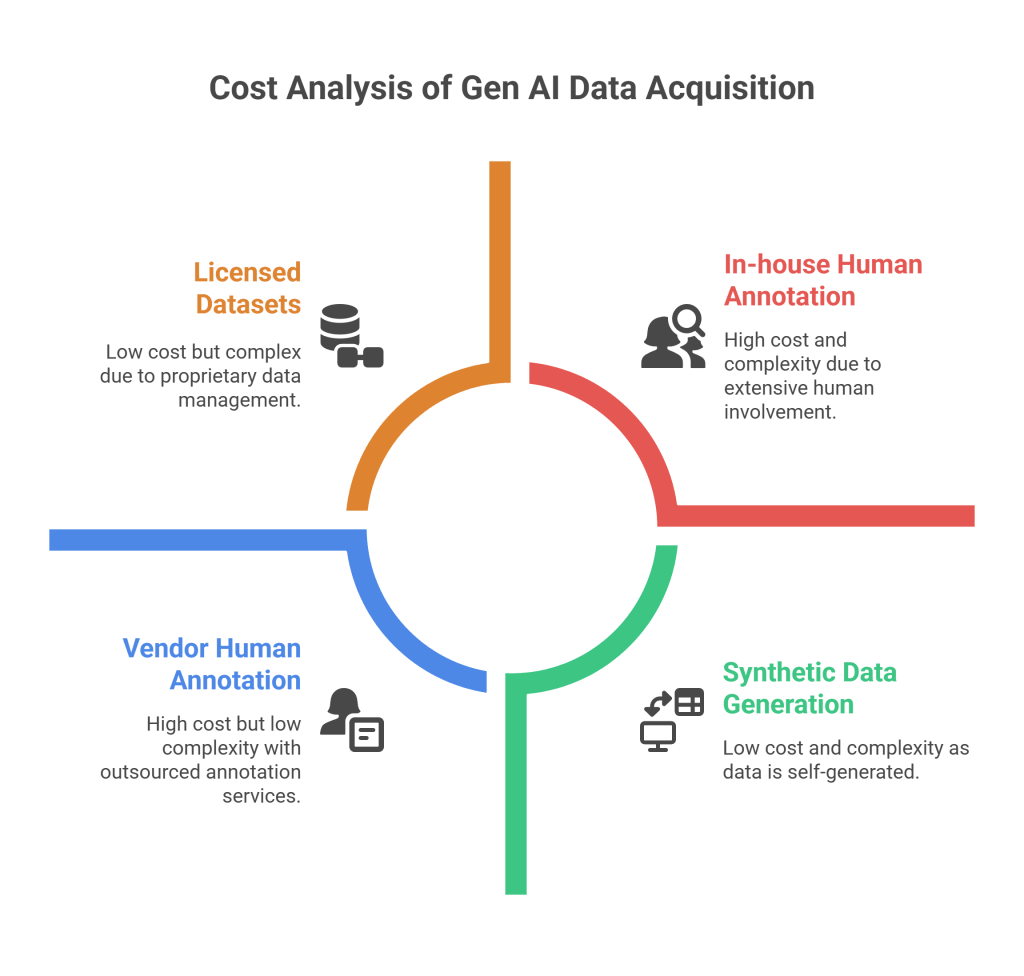
1. Data Acquisition & Preparation
Data is the fuel for your model. Underestimating its cost is a common pitfall.
- Licensed Datasets: The cost of purchasing or licensing proprietary third-party datasets.
- Human Annotation & Labeling: A critical and often expensive component for supervised fine-tuning or Reinforcement Learning from Human Feedback (RLHF).
- Vendor Formula:
(Number of Data Points) x (Cost per Data Point) - In-house Formula:
(Number of Annotators) x (Blended Hourly Rate) x (Total Hours)
- Vendor Formula:
- Synthetic Data Generation: If you create your own data, factor in the compute time and any specialized tooling costs.
2. Model Development & Fine-Tuning
This is frequently the largest single expense during the development phase.

- GPU Compute for Training: The cost of “renting” powerful cloud servers to train or fine-tune your model.
- Core Formula:
(Number of GPUs) x (Cost per GPU per Hour) x (Total Training Hours) - How to Estimate:
- Number & Type of GPUs: Your technical lead will estimate this based on the model’s size and architecture (e.g., fine-tuning a Llama 3 70B model might require 8 x NVIDIA H100 GPUs).
- Cost per GPU per Hour: This is a standard rate from your cloud provider (AWS, GCP, Azure).
- Total Training Hours: An estimate from the technical team for how long a successful training job will run.
- Core Formula:
- Experimentation Buffer: AI development is an iterative, research-driven process. Many training runs will fail, require adjustments, or be part of hyperparameter tuning.
- Best Practice: Add a 20-30% contingency buffer to your training cost estimate to account for necessary experimentation.
3. Human Resources (Development Team)
The cost of the skilled team building the project.

- Formula:
(Number of Team Members) x (Blended Monthly Rate) x (Project Duration in Months) - Roles to Include:
- Generative AI Project Manager
- ML Engineer(s)
- Data Scientist(s)
- MLOps Engineer
- Data Annotators (if in-house)
- Software Engineer (for integration and application development)
4. Software & Tooling (Setup)
One-time or annual license fees for the development environment.
- Examples: MLOps platforms (Weights & Biases, Comet), data annotation software (Labelbox, Scale AI), or other specialized development tools.
Part B: Ongoing Operational Costs (OPEX)
These are the recurring costs to run, monitor, and maintain your model in a production environment.
1. Inference Costs
Once live, every time your model generates a response, it incurs a cost. For high-usage applications, inference costs can quickly surpass training costs.
- Model A: Using a Third-Party API (e.g., OpenAI, Anthropic, Google Gemini)
- Formula:
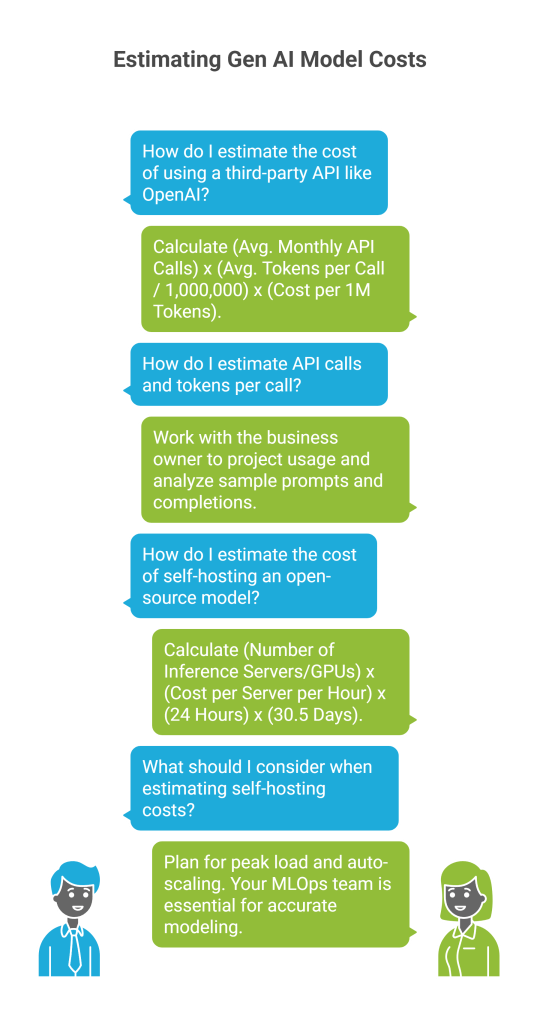
(Avg. Monthly API Calls) x (Avg. Tokens per Call / 1,000,000) x (Cost per 1M Tokens) - How to Estimate:
- API Calls: Work with the business owner to project usage (e.g., number of customers x average interactions per month).
- Tokens per Call: Analyze sample prompts and completions. Remember to account for both input (prompt) and output (completion) tokens.
- Formula:
- Model B: Self-Hosting an Open-Source Model
- Formula:
(Number of Inference Servers/GPUs) x (Cost per Server per Hour) x (24 Hours) x (30.5 Days) - Considerations: This model requires sophisticated planning for peak load and auto-scaling, making estimation more complex. Your MLOps team is essential for modeling this accurately.
- Formula:
2. Monitoring & Maintenance
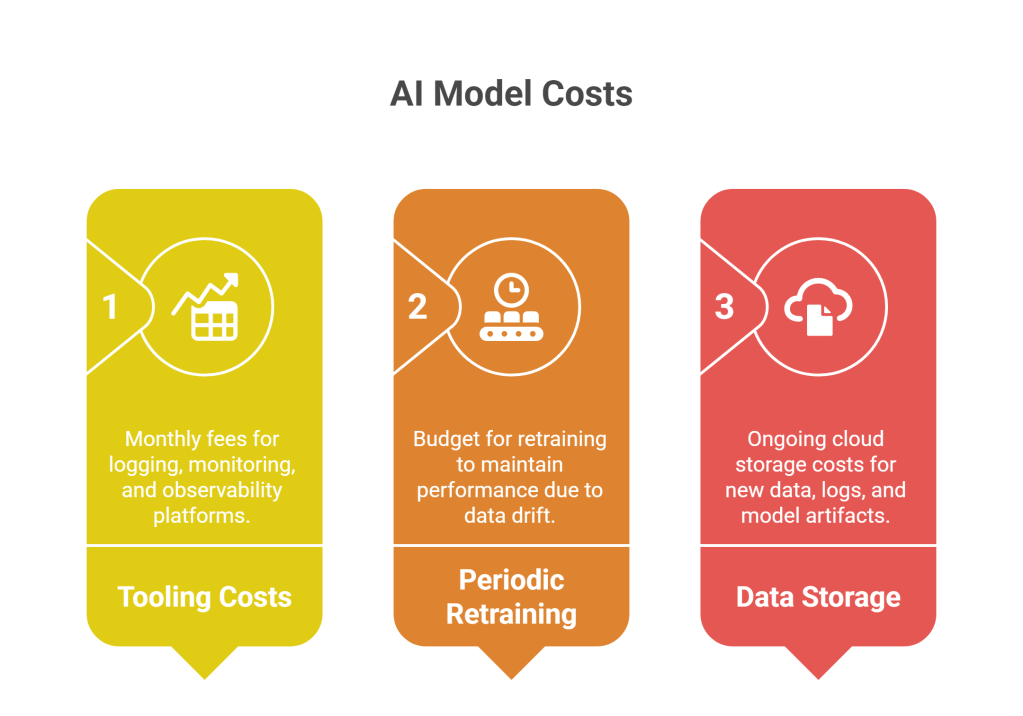
- Tooling Costs: Monthly fees for logging, monitoring, and observability platforms (e.g., Datadog, Sentry, LangSmith, Arize).
- Periodic Retraining/Fine-Tuning: Models degrade over time due to data drift. You must budget for periodic retraining to maintain performance.
- Best Practice: Budget for a full fine-tuning cycle quarterly or semi-annually, depending on the application’s volatility.
- Data Storage: Ongoing cloud storage costs for new data, logs, and model artifacts.
3. Human Resources (Operations)
- On-Call & Support: Allocate a percentage of your MLOps and engineering team’s time for maintaining the live system.
- Human-in-the-Loop (HITL): If your system requires human review or correction of model outputs, this is a significant and recurring operational cost.
- Formula:
(Number of Reviewers) x (Hourly Rate) x (Hours per Month)
- Formula:
Section 2: Quantifying the Return on Investment (ROI)
A financial model is incomplete without quantifying the business value. This requires close collaboration with business stakeholders to translate the project’s impact into financial terms.
1. Identifying Value Drivers
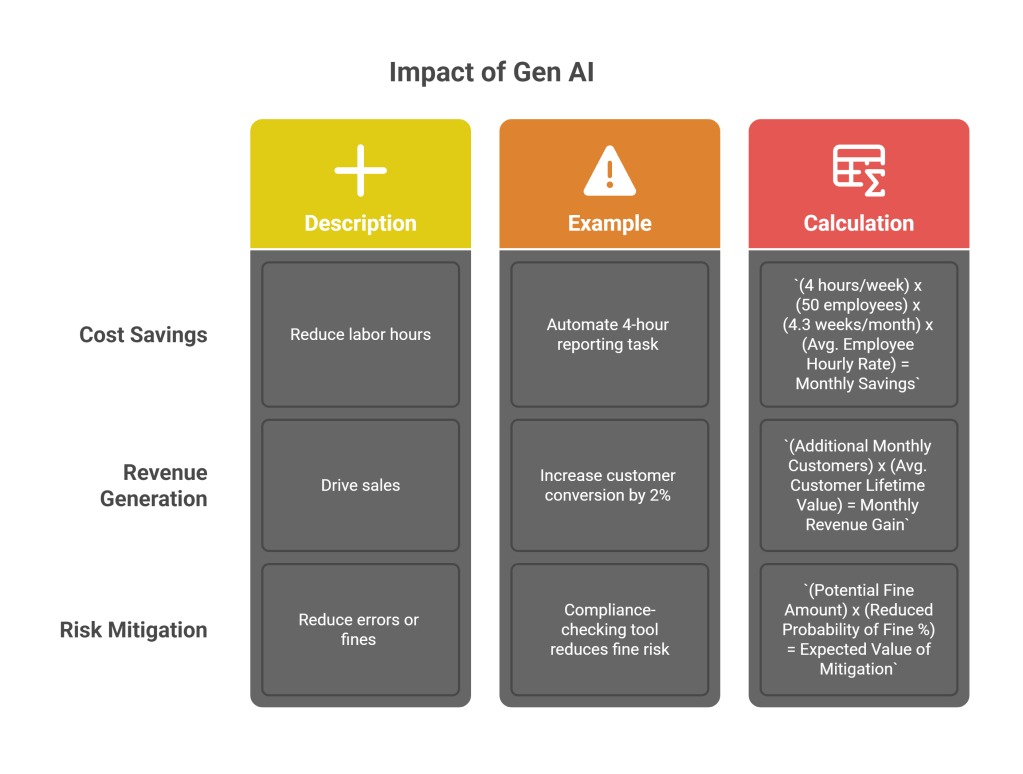
- Cost Savings (Efficiency): Automating or augmenting tasks to reduce labor hours.
- Example: An internal tool automates a 4-hour reporting task for 50 employees weekly.
- Calculation:
(4 hours/week) x (50 employees) x (4.3 weeks/month) x (Avg. Employee Hourly Rate) = Monthly Savings
- Revenue Generation (Growth): Creating new products or features that drive sales.
- Example: A new Gen AI feature is projected to increase customer conversion by 2%.
- Calculation:
(Additional Monthly Customers) x (Avg. Customer Lifetime Value) = Monthly Revenue Gain
- Risk Mitigation (Compliance & Safety): Reducing the likelihood of costly errors or fines.
- Example: A compliance-checking tool reduces the risk of a specific type of fine.
- Calculation:
(Potential Fine Amount) x (Reduced Probability of Fine %) = Expected Value of Mitigation
2. Key Financial Metrics to Present
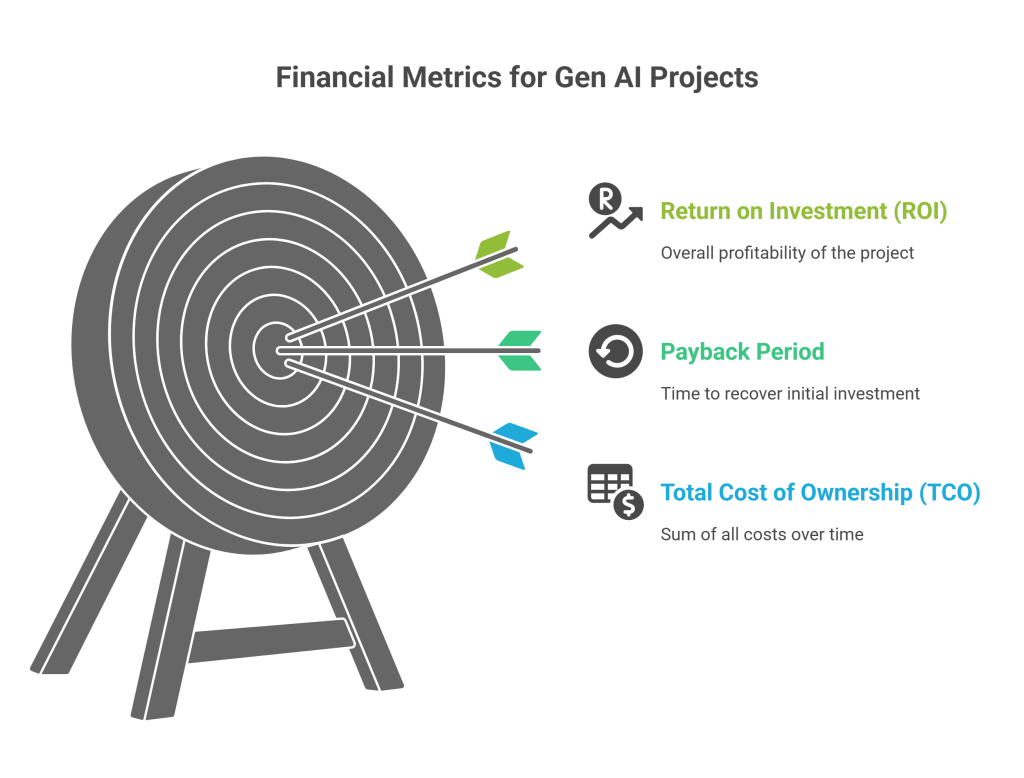
- Total Cost of Ownership (TCO): The sum of all development and operational costs over a specific period (e.g., 3 years).
- Payback Period: The time it takes for the project’s net benefits to cover the initial investment.
- Formula:
Initial Investment / Annual Net Benefit
- Formula:
- Return on Investment (ROI): The overall profitability of the project, expressed as a percentage.
- Formula:
((Net Benefit - Total Investment) / Total Investment) * 100%
- Formula:
Section 3: Essential Metrics for Project Control
Beyond pure financials, a Gen AI PM must track metrics related to model performance, team productivity, and schedule adherence. These should be defined during planning and tracked rigorously.

1. Model Performance & Safety Metrics
- Hallucination Rate: Measures how often the model generates factually incorrect or nonsensical information. Calculated by having human experts evaluate a statistically significant sample of outputs.
- Formula:
(Number of Hallucinated Responses / Total Sampled Responses) * 100
- Formula:
- Toxicity Score: Quantifies the level of harmful or biased content. Typically measured by running outputs through a moderation API (e.g., Google Perspective) and tracking the rate of violations against a predefined threshold.
- Task-Specific Metrics (e.g., BLEU/ROUGE): For tasks like summarization or translation, these scores compare machine-generated text to human-written references to measure precision and recall.
2. Team & Process Metrics
- Annotation Quality (Inter-Annotator Agreement – IAA): Measures the consistency of your human data labelers using a statistical method like Cohen’s Kappa. A score > 0.7 is typically considered good. High IAA is critical for high-quality training data.
- Team Velocity: In an Agile framework, this measures the amount of work (in story points) the development team completes per sprint, helping to forecast future work more accurately.
3. Financial & Schedule Tracking
- Budget Variance: Measures how actual spending compares to your plan.
- Formula:
Actual Cost (AC) - Planned Value (PV)
- Formula:
- Schedule Variance: Measures if you are ahead of or behind schedule in terms of value delivered.
- Formula:
Earned Value (EV) - Planned Value (PV)
- Formula:
Section 4: Financial Model Template Example
This simplified template should be built out in a spreadsheet tool. It illustrates how to structure your costs and benefits over time.
Project: AI-Powered Customer Support Chatbot (3-Month Development)
| Cost/Benefit Category | Item | Assumptions / Formula | Month 1 | Month 2 | Month 3 | Month 4 (Live) | … Year 1 Total |
| A. DEVELOPMENT COSTS | |||||||
| 1. Data | Annotation (Vendor) | 5,000 tickets @ $2/ticket | $10,000 | $10,000 | |||
| 2. Model Training | GPU Compute (Fine-tune) | 4x H100s @ $4/hr for 48 hrs | $768 | $768 | |||
| Experimentation Buffer | 25% of Training Cost | $192 | $192 | ||||
| 3. Human Resources | Dev Team (5 people) | 5 x $10,000/month | $50,000 | $50,000 | $50,000 | $150,000 | |
| TOTAL DEV COSTS | $60,000 | $50,960 | $50,000 | $160,960 | |||
| B. OPERATIONAL COSTS | |||||||
| 1. Inference | OpenAI API Usage | 200k calls/mo @ $0.50/1M tokens | $75 | $675 (for 9 mo) | |||
| 2. Monitoring | LangSmith License | Pro Plan | $300 | $2,700 (for 9 mo) | |||
| 3. Maintenance | MLOps Support | 10% of 1 engineer’s time | $1,000 | $9,000 (for 9 mo) | |||
| TOTAL OPEX | $0 | $0 | $0 | $1,375 | $12,375 | ||
| C. BUSINESS VALUE | |||||||
| Cost Savings | Reduced Agent Time | 20 agents save 10 hrs/mo @ $30/hr | $6,000 | $54,000 (for 9 mo) | |||
| TOTAL MONTHLY BENEFIT | $0 | $0 | $0 | $6,000 | $54,000 | ||
| NET CASH FLOW | Benefit – (Dev + Opex) | ($60,000) | ($50,960) | ($50,000) | $4,625 | ($119,335) |
Section 5: Best Practices for the Generative AI PM
- Collaborate, Don’t Isolate: Your financial model will be inaccurate without deep, continuous input from your technical lead, MLOps team, and business stakeholders.
- Embrace Uncertainty: Build a contingency buffer (15-25% is standard) into your overall budget. AI projects have inherent R&D risk that must be accounted for.
- Tag Everything: Mandate the use of cloud provider cost management tools (e.g., AWS Cost Explorer) and resource tags. This is the only way to track real-time spending against your model’s components.
- Review and Iterate: Your financial model is a living document. Review it monthly with your team and leadership, updating forecasts based on actuals and any changes in project scope.
- Communicate with Clarity: When presenting to stakeholders, focus on the key assumptions, TCO, and ROI. Be prepared to defend your estimates and clearly explain the unique cost drivers of Generative AI.
Generative AI Financial Formulas Cheat Sheet
This table breaks down the essential calculations needed for a comprehensive Generative AI financial model. It is divided into Development Costs (upfront investment), Operational Costs (ongoing expenses), and Business Value (the return).
Part 1: Development & Setup Costs (CAPEX-like)
| Category | Formula | Why This Factor is Important | How to Estimate / Source the Data |
| Data Annotation (Vendor) | (Number of Data Points) x (Cost per Data Point) | This is often a major upfront cost. The quality of your training data directly determines the quality of your model’s performance. | Get quotes from data labeling vendors like Scale AI or Appen. The cost per data point varies based on complexity (e.g., simple classification vs. complex text annotation). |
| Data Annotation (In-house) | (Number of Annotators) x (Blended Hourly Rate) x (Total Hours) | Use this if you are managing the labeling process internally. It captures the direct labor cost. | Work with HR to get a blended hourly rate for your annotators. Estimate the time per data point and multiply by the total number of points to get total hours. |
| GPU Compute for Training | (Num of GPUs) x (Cost per GPU/Hour) x (Total Training Hours) | This is the core technical cost of model development and is often the largest single development expense. | Tech Lead provides: Number and type of GPUs needed. Cloud Provider (AWS, GCP, Azure) provides: Cost per GPU per hour. Tech Lead estimates: Total training hours for a successful run. |
| Experimentation Buffer | (Total Training Cost) x (15% to 30%) | AI development is not linear. This buffer accounts for failed runs, tuning, and R&D, preventing budget overruns. | This is a policy-based estimate. A 20-25% buffer is a standard, safe starting point for most fine-tuning projects. Increase for more experimental R&D. |
| Human Resources (Dev) | (Num of Team Members) x (Blended Monthly Rate) x (Project Duration in Months) | The cost of your specialized talent is a primary driver of the project budget. | Get blended monthly rates from HR/Finance for roles like ML Engineer, Data Scientist, etc. The project plan will define the team size and duration. |
Part 2: Ongoing Operational Costs (OPEX)
| Category | Formula | Why This Factor is Important | How to Estimate / Source the Data |
| Inference (3rd Party API) | (Avg. Monthly Calls) x (Avg. Tokens per Call / 1M) x ($ per 1M Tokens) | For high-volume applications, this recurring cost can exceed the initial training cost. It’s the direct cost of using the model in production. | Business Owner projects: Average monthly calls/users. Technical Team analyzes: Average tokens per interaction (prompt + completion). API Provider (OpenAI, Anthropic) provides: Pricing per 1M tokens. |
| Inference (Self-Hosted) | (Num of Servers/GPUs) x (Cost per Server/Hour) x 730 Hours/Month | Captures the cost of running your own infrastructure 24/7. Requires careful capacity planning. | MLOps/Infra Team determines: Number of servers needed to handle projected peak load and maintain latency SLAs. Cloud Provider provides: Cost per server/GPU per hour. |
| Human-in-the-Loop (HITL) | (Number of Reviewers) x (Hourly Rate) x (Monthly Hours) | If your system requires human oversight for quality or safety, this becomes a significant and permanent operational labor cost. | Business Owner defines: The percentage of outputs that need review and the time per review. This determines the total monthly hours needed. Get hourly rates from HR. |
| Periodic Retraining | (Cost of a Single Fine-Tuning Run) x (Number of Retrains per Year) | Models drift and their performance degrades. This budgets for keeping the model up-to-date and effective. | Use the “GPU Compute for Training” formula for a single run. The business context determines the frequency (e.g., quarterly, semi-annually). |
Part 3: Business Value & Financial Metrics
| Category | Formula | Why This Factor is Important | How to Estimate / Source the Data |
| Cost Savings | (Time Saved per Task) x (Num of Employees) x (Frequency) x (Employee Hourly Rate) | This directly translates the project’s efficiency gains into a clear financial benefit. It’s often the easiest value to quantify. | Work with the business unit impacted. They can provide data on current process times, employee counts, and task frequency. Get rates from HR/Finance. |
| Revenue Generation | (Additional Customers/Sales) x (Avg. Customer Lifetime Value or Avg. Deal Size) | This links your Gen AI feature directly to top-line growth, which is highly compelling for stakeholders. | This is a forecast. Work with Sales, Marketing, and Finance to build a realistic projection based on expected conversion lifts or new market opportunities. |
| Payback Period | Total Initial Investment / Annual Net Benefit | Measures how quickly the project pays for itself. A shorter payback period means lower risk. | Total Initial Investment: Sum of all Development Costs. Annual Net Benefit: (Annual Value Generated) – (Annual Operational Costs). |
| Return on Investment (ROI) | ((Net Benefit - Total Investment) / Total Investment) * 100% | The ultimate measure of the project’s profitability over its lifetime. It answers “What do we get back for every dollar we put in?” | Net Benefit: (Total Value Generated over X years) – (Total Operational Costs over X years). Total Investment: Sum of all Development Costs. |
Discover more from SkillWisor
Subscribe to get the latest posts sent to your email.
